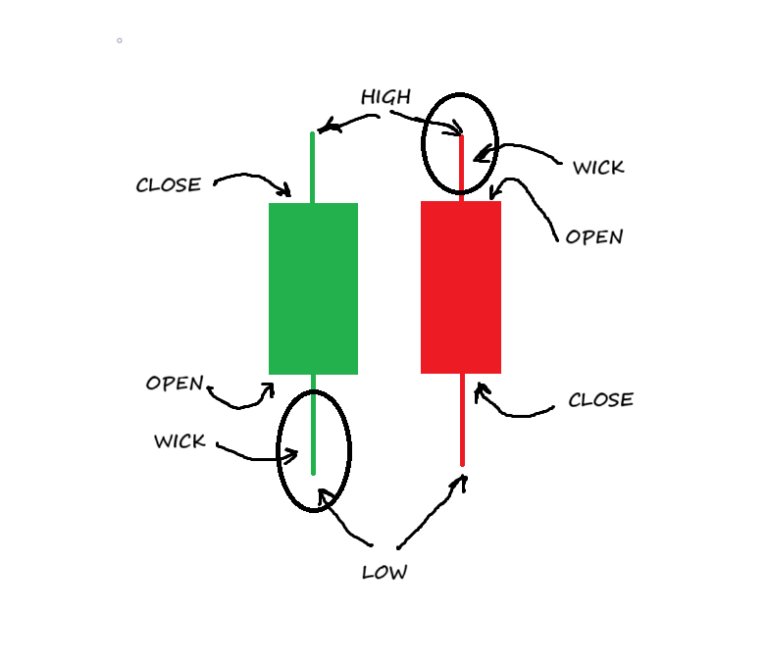
Candlesticks are a graphical representation of price at each time period. A bullish candle would open at a price level, then travel up or down doesn’t really matter then the candle would close at a price higher than where it opened. A bearish candle is obviously just the opposite.
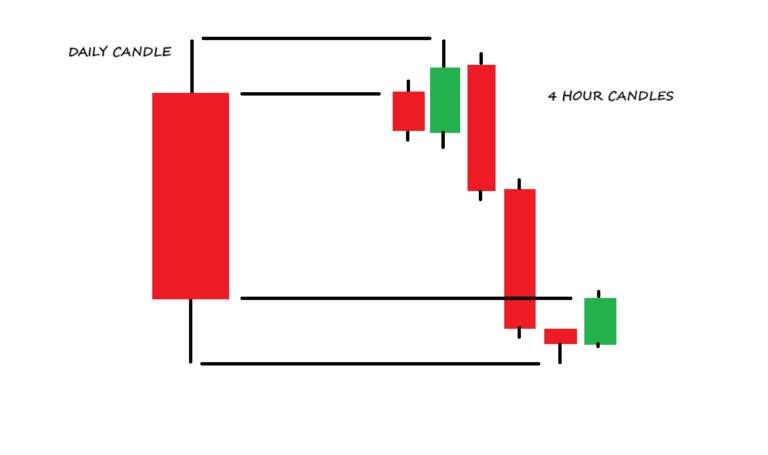
I included a picture of a daily candle, which of course contains six four-hour candles. This would show the possible price action of a single day. Candlesticks are time-based, meaning they represent a specific time period. Some people trade the 2-minute candlestick chart or the 15-minute chart; others may only look at the daily.
There are other ways to represent price action, like tick charts, Renko, Heikin Ashi, and others. Part of your journey should be to fall down the rabbit hole and play and explore these different instruments.
Trading is hard. You will want to quit. You will want to smash your keyboard against the wall. Then there are these moments of clarity that make you say, “Hey, I understand.”If you want to get started in trading, you need to learn candlestick charts. Whether you use them or not doesn’t really matter; you need to learn them because everybody looks at them, from the newbies to the huge fund managers. You want your analysis and market prep to include what the big players are doing.
It’s good to use candlesticks to see where the market is in the big picture. You want to get a read on price action, where it is, where it was, and where it might be going. I will usually look at the charts at the beginning of the trading day and possibly at the end, but I don’t make my decisions based on what the candlesticks are doing.
Knowing that the fund managers and the professionals are usually looking at a daily chart, it might be helpful to use that as a bellwether to see certain levels where price may react, but you don’t simply buy or sell at those levels; you need to wait and be patient and watch for the reaction at those levels.
learning candlesticks and being able to watch the market I think it is the first step to learn how to trade. My journey has taken me from candlestick charts to Renko, to volume and market profile, to order flow, and many other directions. Your journey will be unique to you; everybody’s journey is different, but this is a good starting point.